Fichier:Sine with partial backgrounds.png
Aller à la navigation
Aller à la recherche
Pas de plus haute résolution disponible.
Sine_with_partial_backgrounds.png (503 × 331 pixels, taille du fichier : 9 kio, type MIME : image/png)
Description
| Description |
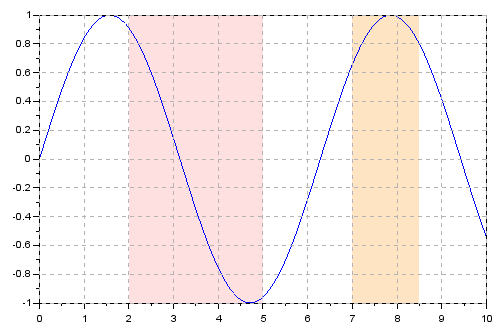
Français : Fonction sinus avec des zones ayant des couleurs de fond différentes.
English: Sine function, with zones having different background colours. |
| Date | |
| Source | http://mailinglists.scilab.org/Scilab-users-Plot-w-part-of-background-in-a-different-color-tp4033624p4033625.html |
| Auteur | Samuel Gougeon |
Scilab source
 |
This media was created with Scilab, a free open-source software. Here is a listing of the Scilab source used to create this file. |
x = linspace(0, 10, 100);
clf
drawlater
plot(x, sin(x))
xgrid(color("grey70"))
xfpolys([2 5 5 2 ; 7 8.5 8.5 7]',[-1 -1 1 1 ; -1 -1 1 1]',..
         [color("scilabpink") color("bisque")])
r = gca();
r.grid_position = "foreground";
r = r.children(1).children;
r.line_mode="off";
r(1).data(:, 3)=-1;
r(2).data(:, 3)=-1;
drawnow
Conditions d’utilisation
| Ce document n'est pas soumis au droit d’auteur ( copyright ) et est donc dans le domaine public, car il est composé exclusivement d’informations qui sont des propriétés communes et ne contient aucune modification qui en ferait une œuvre originale.
|
The sine function is a simple mathematica shape. The picture was made to illustrate the possibility with Scilab to create zones with different background colour. It can be made by anyone using the source code.
Historique du fichier
Cliquer sur une date et heure pour voir le fichier tel qu'il était à ce moment-là.
| Date et heure | Vignette | Dimensions | Utilisateur | Commentaire | |
|---|---|---|---|---|---|
| actuel | 7 mars 2016 à 09:44 | | 503 × 331 (9 kio) | wikimediacommons>Cdang | User created page with UploadWizard |
Utilisation du fichier
La page suivante utilise ce fichier :